FIG. 3.
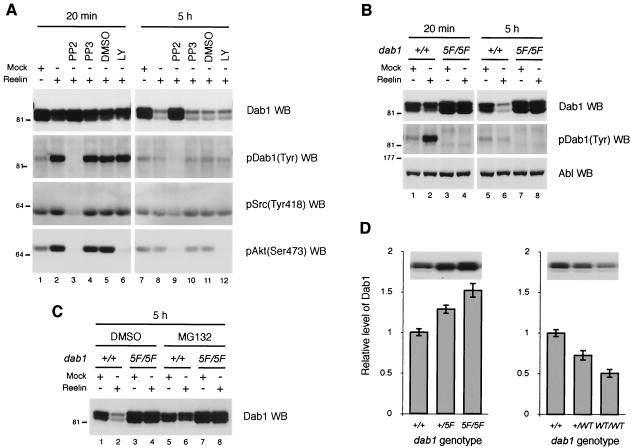
Reelin-induced degradation of Dab1 correlates with tyrosine phosphorylation of Dab1 and activation of SFKs. (A) Mouse cortical neuron cultures were left untreated (lanes 1 and 2 and lanes 7 and 8) or treated with PP2 (10 μM) (lanes 3 and 9), PP3 (10 μM) (lanes 4 and 10), DMSO (lanes 5 and 11), or LY294002 (LY [50 μM]) (lanes 6 and 12) for 30 min before being stimulated with Reelin-containing or mock supernatant as indicated (in the presence of inhibitors) for 20 min (lanes 1 to 6) or 5 h (lanes 7 to 12). Total lysates were subjected to SDS-PAGE and Western blot analysis using anti-Dab1 antibodies to detect total Dab1 (Dab1 WB), an anti-phosphotyrosine antibody to detect tyrosine-phosphorylated Dab1 [pDab1(Tyr) WB], anti-phospho-Src(Tyr418) antibodies [pSrc(Y418) WB], or anti-phospho-Akt(Ser473) antibodies [pAkt(S473) WB]. (B) Neuron cultures were prepared from littermate embryos derived from dab15F/+ parents and subsequently genotyped. The cultures corresponding to dab1+/+ (lanes 1 and 2 and lanes 5 and 6) or dab15F/5F (lanes 3 and 4 and lanes 7 and 8) embryos were treated with Reelin-containing or mock supernatant as indicated for 20 min (lanes 1 to 4) or 5 h (lanes 5 to 8). Total lysates were subjected to SDS-PAGE and Western blot analysis using anti-Dab1 antibodies to detect total Dab1 (Dab1 WB), an anti-phosphotyrosine antibody to detect tyrosine-phosphorylated Dab1 [pDab1(Tyr) WB] or an anti-Abl antibody (Abl WB) as a loading control. (C) Neuron cultures were prepared as described for panel B. The cultures corresponding to dab1+/+ (lanes 1 and 2 and lanes 5 and 6) or dab15F/5F (lanes 3 and 4 and lanes 7 and 8) embryos were treated with Reelin-containing or mock supernatant (as indicated) for 5 h in the presence of DMSO (lanes 1 to 4) or MG132 (lanes 5 to 8). Total lysates were subjected to SDS-PAGE and Western blot analysis using anti-Dab1 antibodies (Dab1 WB). (D) Dab1 protein levels in dab15F/5F and dab1WT/WT E16.5 brains. Brain lysates were prepared from mouse E16.5 embryos derived from dab15F/+ (left graph [n = 18]) or dab1WT/+ (right graph [n = 18]) parents, and Dab1 protein levels were determined by Western blot analysis using anti-Dab1 antibodies (examples are shown above each graph) and the anti-βIII tubulin antibody TUJ1 for normalization of the loading (data not shown) (standard deviation, 1.8%; n = 36). The relative levels of Dab1 proteins were normalized to the average Dab1 level in wild-type embryos (set to 1.0) (standard deviation, 4.1%; n = 11) and were plotted against the genotypes of embryos as indicated. Error bars represent standard deviations.

