
Figure 7.
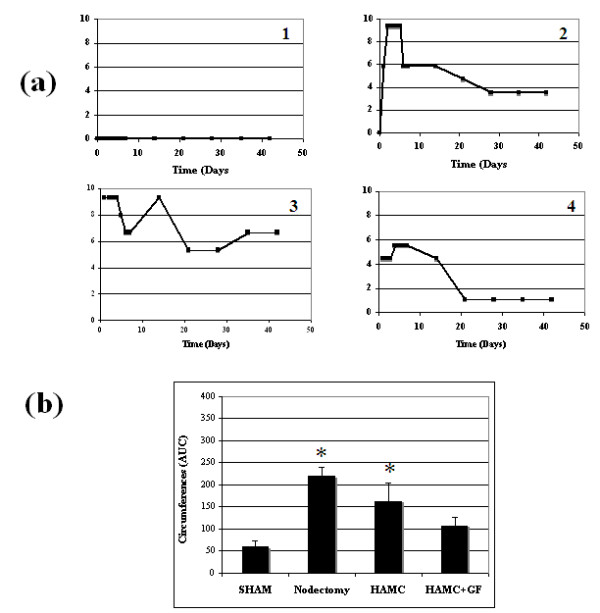
Development of edema following popliteal lymph node excision in the presence and absence of growth factor therapy. (a) Typical examples of edema formation in each treatment group (n = 1) are displayed. (b) The area under the curve (AUC) was calculated for animals using the trapezoidal rule. Node removal (nodectomy (2)) and node removal with HAMC (3) usually resulted in a sharp increase in edema formation over the first week and decreased marginally over the next 5 wk. In contrast, growth factor-treated groups displayed reduced edema levels by 6 wk (4), statistically similar to sham levels (1). Each bar represents mean ± SEM. Sham n = 18, nodectomy n = 36, HAMC n = 7, HAMC + GF n = 7. Significance in comparison to sham levels was assessed by ANOVA and Dunnett's one sided t-test. *P < 0.05.