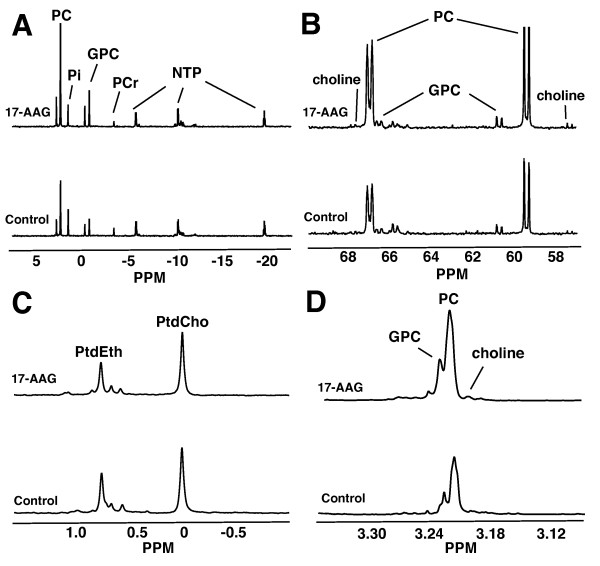
Figure 4.
Representative 31P, 13C, and 1H spectra of cell extracts. Representative spectra of control (bottom) and 17-AAG-treated (top) MCF-7 cells illustrate increased PC, intracellular choline, and GPC levels and unchanged PtdCho levels. (a) 13P spectra of the aqueous cell extract fraction depicting an increase in total PC and GPC levels after treatment. (b) 13C spectra of the aqueous cell extract fraction depicting an increase in de novo synthesized PC, GPC, and intracellular choline. (c) 31P spectra of the lipid cell extract fraction depicting constant PtdCho with 17-AAG treatment. (d) 1H spectra of the aqueous cell extract fraction depicting an increase in the intracellular choline, PC, and GPC concentrations. 17-AAG, 17-allyamino-17-demethoxygeldanamycin; GPC, glycerophosphocholine; NTP, nucleoside triphosphate; PC, phosphocholine; PCr, phosphocreatine; Pi, inorganic phosphate; PPM, parts per million; PtdCho, phosphatidylcholine; PtdEth, phosphatidylethanol.

