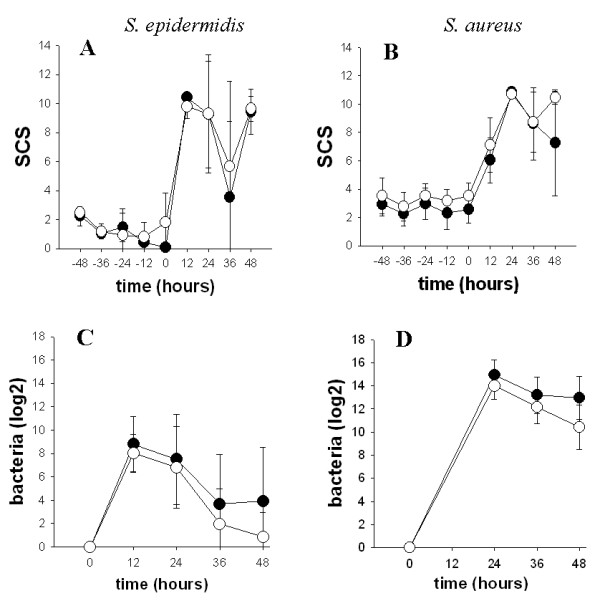
Figure 1.

Evolution of SCS and bacteriology titres before and after S. epidermidis and S. aureus challenges. A and B. SCC were measured in the inoculated half-udder from 48 hours before to 48 hours after challenge. SCS were computed from the SCC with a log-2 transformation and their time evolution are drafted on the graph. C and D. Bacteriology counts were measured at the same time points (the time 12 hours post-inoculation with S. aureus is missing). All mammary glands were free of infection before inoculation. The positive values were transformed in score by a log-10 formula. The resistant line is represented in open symbols and the susceptible line in closed symbols. Figures A and C correspond to S. epidermidis and Figures B and D correspond to S. aureus challenge.
