
Figure 4.
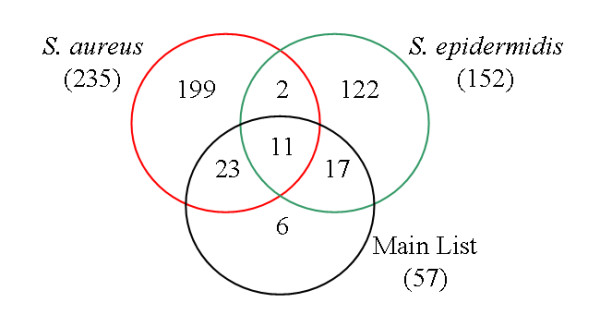
Venn diagram of the differentially expressed genes between the resistant and susceptible lines. The three lists of differentially-expressed genes between the lines were compared using a Venn diagram: the main list (n = 57 probes, FDR q-value < 0.05, aFC > 1.5), and the list from the single-challenge analysis S. aureus and S. epidermidis (t-test, p < 0.01, aFC > 1.5, nSa = 235 probes and nSe = 152 probes, respectively). A total of 380 probes are represented.