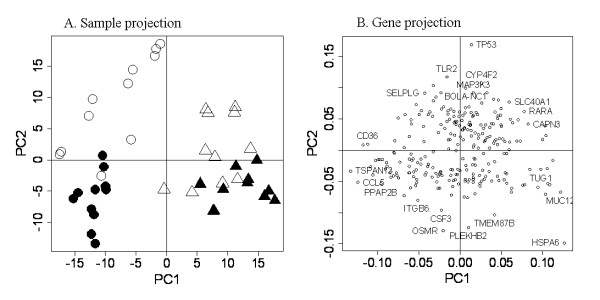
Figure 5.
Principal component analysis of the differentially-expressed probes between resistant and susceptible lines. PCA was performed with R on the 380 probes that are differentially expressed between the lines from the pooled list. (A) All samples from the four conditions - Low-SCS animals infected by Se (open triangle), Low-SCS animals infected by Sa (open circle), High SCS animals infected by Se (closed triangle) and High SCS animals infected by Sa (closed circle) were separated based on Line-Challenge along the principal component 1 (PC1) and PC2 axes. PC1 explained 11.2% of the total variations and mainly discriminates the challenges whereas the PC2 explained 7.8% of the total variations and segregates between the lines. (B) The 380 probes were projected on PC1 and PC2.

