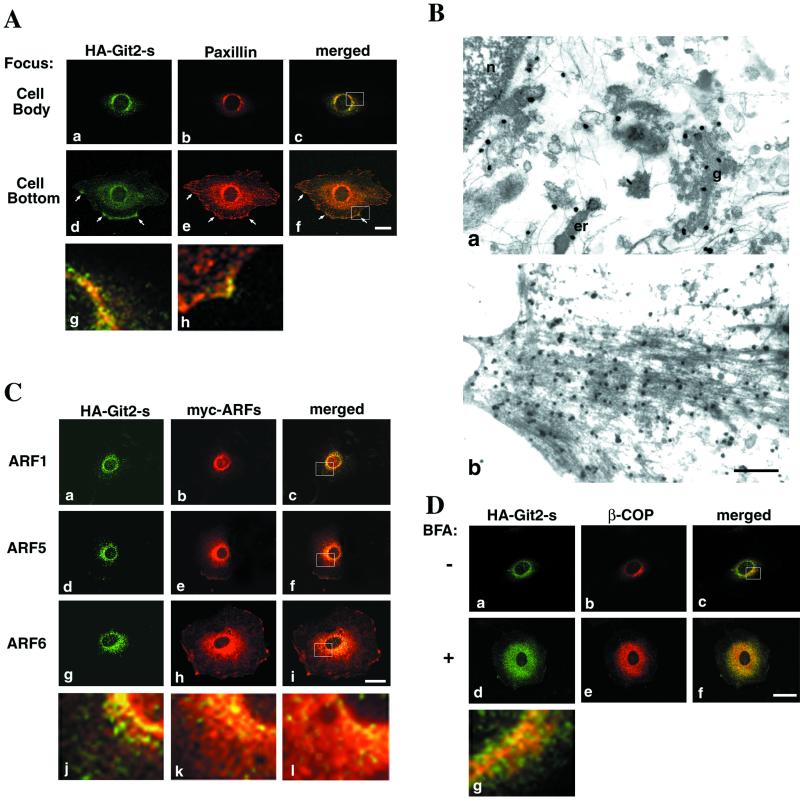
Figure 3.
Subcellular localization of Git2-short. 3Y1 cells stably expressing HA-Git2-short by BOSC23 retrovirus infection and plated onto fibronectin-coated (10 μg/ml) chamber slides are shown. Note that HA-Git2-short was not overexpressed but expressed at a level only about two- to threefold higher than that of the endogenous Git2-short (Mazaki and Sabe, unpublished results). (A) Comparison with paxillin. Cells were fixed and immunolabeled using mouse anti-HA antibody (a and d) and rabbit anti-paxillin antibody (b and e). Focuses were adjusted 3.0 μm above the surface of the glass chamber plates (a–c), across the center of the nucleus in the majority of cells, or 0.5 μm above the surface of the glass chamber plates (d–f), near the bottom layers of the cells. All confocal images were taken from the same single cell. Arrows in d–f indicate Git2-short localization to focal complexes at the cell periphery. Panels g and h are a higher magnification of the merged images shown in c and f (indicated by rectangles), respectively. (B) Immunoelectron microscopic study of Git2-short subcellular localization. Anti-HA antibody was used to detect HA-Git2-short. a, perinuclear area; b, cell periphery. n, nucleus; er, ER; g, Golgi-like structure. The gold particles are shown as black dots. Bar, 500 nm. In untransfected parental 3Y1 cells, no significant signals were detected. (C) Comparison with ARF isoforms. 3Y1/HA-Git2-short cells were further transfected with each of myc-tagged ARF cDNA (a–c, ARF1; d–f, ARF5; g–i, ARF6) in pBabe vector using the BOSC23 retrovirus infection method. After fixation, cells were immunolabeled with mouse anti-HA antibody (a, d, and g) and rabbit anti-myc antibody (b, e, and h). The size and morphology of cells expressing the ARFs were similar to the cells shown in A. Note that the cDNAs for these ARF proteins were driven bythe murine retrovirus promoter in the pBabe vector and hence not overexpressed. j, k, and l are a higher magnification of the merged images shown in c, f, and i (indicated by rectangles), respectively. (D) Comparison with β-COP. 3Y1/HA-Git2-short cells, untreated or treated with 5 μg/ml BFA for 30 min, were fixed and immunolabeled with mouse anti-HA antibody (a and d) and rabbit anti-β-COP antibody (b and e). β-COP is tightly localized to perinuclear areas (b), and the size and morphology of cells were almost unchanged by BFA treatment (d–f). g is a higher magnification of the merged image shown in c (indicated by a rectangle). In A, C, and D, each immunolabeling was visualized by further incubation with Cy2-conjugated anti-mouse IgG and Cy3-conjugated anti-rabbit IgG. In C and D, focuses were adjusted 3.0 μm above the surface of the glass chamber plates, across the center of the nucleus in the majority of cells. The right columns represent the merging of the left and the middle images. Bars, 20 μm. Essentially the same results were obtained with NIH3T3 cells stably expressing HA-Git2-short (Mazaki and Sabe, unpublished results).

