
Figure 3.
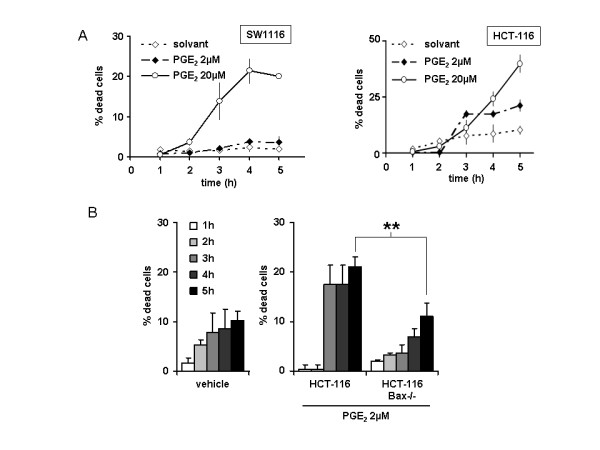
Effect of PGE2 cytoplasmic microinjection. A: SW1116 and HCT-116 cells were microinjected with PGE2 as described in the material and methods section. The graph represents the amount of dead cells among the microinjected population over the time. B: PGE2 microinjection was performed in HCT-116 and HCT-116Bax-/- cells as in A.