
Figure 2.
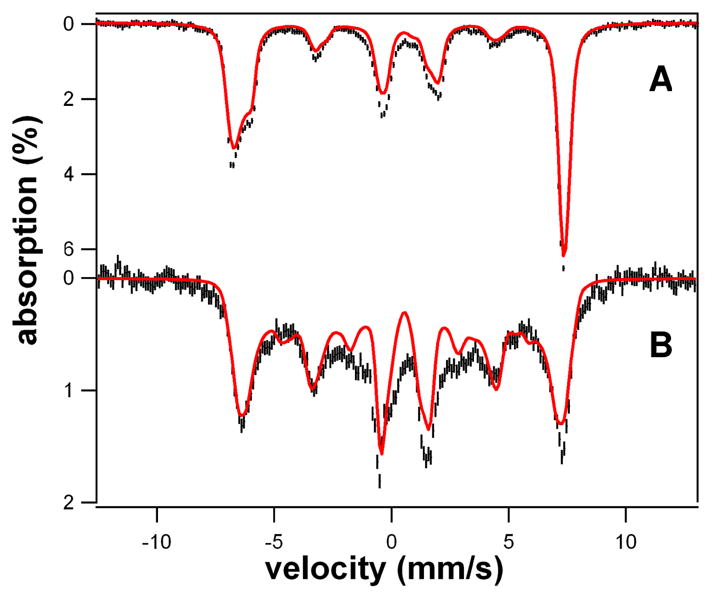
4.2 K Mössbauer spectra of 1 and 2 in 3:1 PrCN/MeCN (v/v) recorded in parallel applied fields (black lines) and simulations (red lines); simulation parameters and comments are given in Table S1 and Supporting Information. (A) 8.0 T spectrum of 1; same batch as used for EPR shown in Fig. 3A. (B) 1.2 T spectrum of 2. The red line is a spectral simulation, assuming slow relaxation of the electronic system. 10% of 3 was removed from the data. Approximately 80% of the Fe in the sample belongs to 2.