
Figure 4.
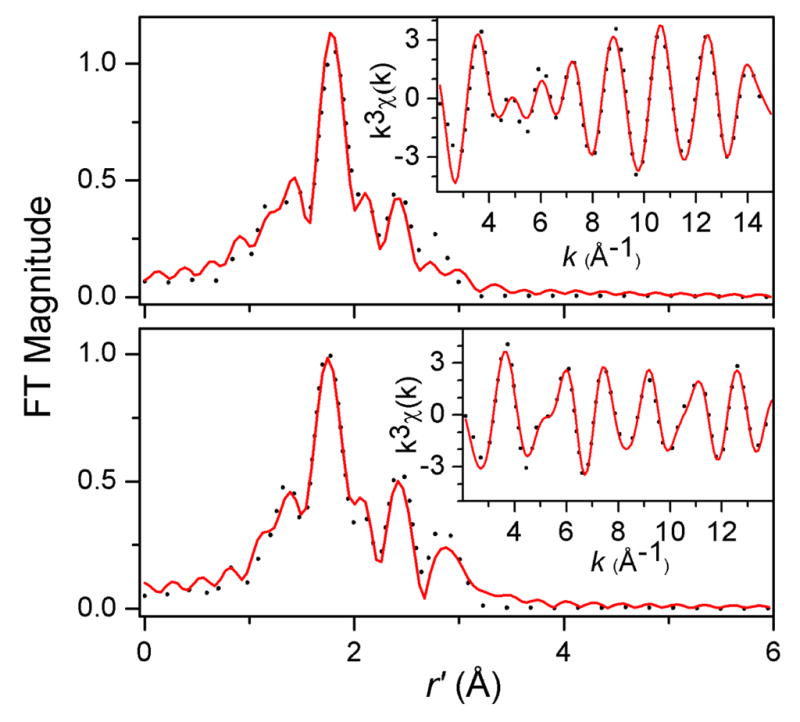
Top: Fourier transform of Fe K-edge EXAFS of 1 (dotted line) over a k-range of 2–15 Å−1 and a back-transformation range of 0.3–3.0 Å−1. Inset: Fourier-filtered k3χ(k) EXAFS data (dotted line). Solid lines represent fit 9 in Table S2. Bottom: Fourier transform of Fe K-edge EXAFS of 2 (dotted line) over a k-range of 2–14 Å−1 and a back-transformation range of 0.3–3.2 Å−1. Inset: Fourier-filtered k3χ(k) EXAFS data (dotted line). Solid lines represent fit 9 in Table S3.