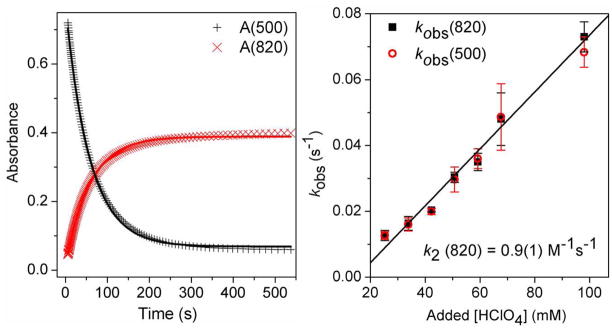
Figure 6.
Left: Plots of absorbance at 500 nm and 820 nm vs. time for the conversion of 2 to 3. Solid lines represent fits of reaction progress (absorbance at 500 nm and 820 nm) against time to a typical first-order rate equation. Experimental conditions: 1.5 mM 2, 34 mM HClO4, −40 °C, in CH3CN. Right: Plot of kobs(820) and kobs(500) vs. added [HClO4] for the conversion of 2 to 3. Experimental conditions: 1.5 mM 2, −40 °C, in CH3CN. The black line is a linear fit for kobs(820). See Supporting Information for additional experimental details.

