
Fig. 5.
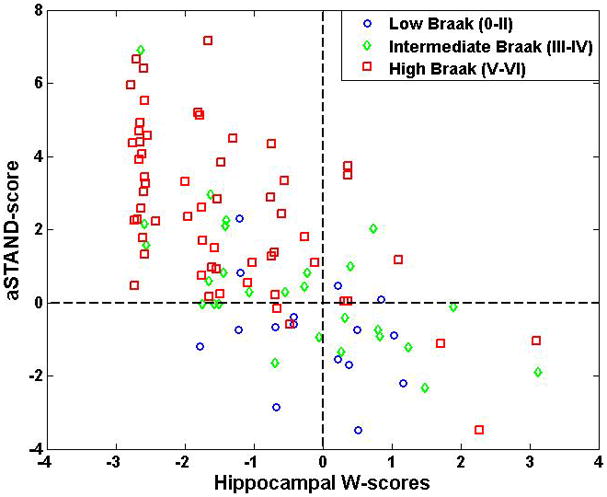
Scatter plot showing relationship between aSTAND-score and hippocampal W score. For convenience, reference lines at a W score of zero and aSTAND-score of 0 have been added to the plot.
Official websites use .gov
A
.gov website belongs to an official
government organization in the United States.
Secure .gov websites use HTTPS
A lock (
) or https:// means you've safely
connected to the .gov website. Share sensitive
information only on official, secure websites.
Scatter plot showing relationship between aSTAND-score and hippocampal W score. For convenience, reference lines at a W score of zero and aSTAND-score of 0 have been added to the plot.