Fig. 3.
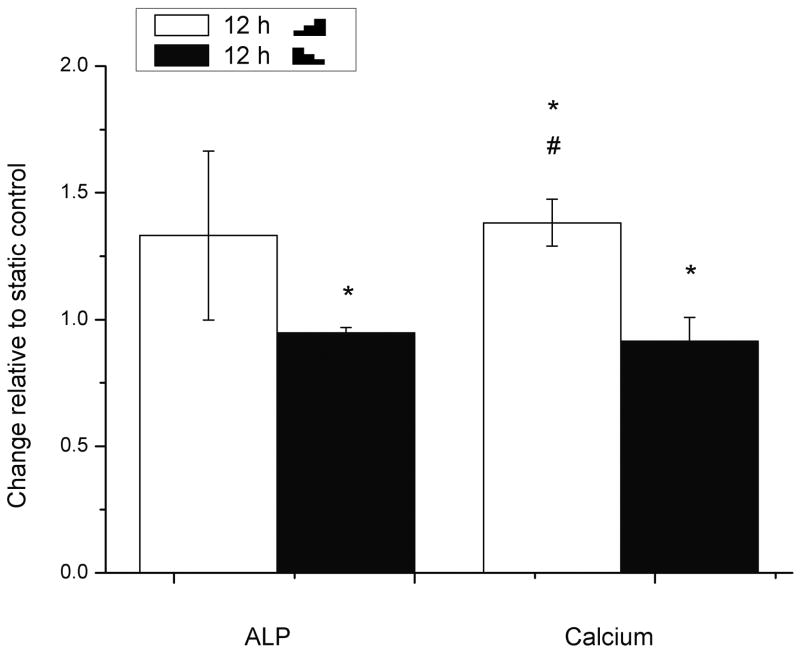
The ALP activity and calcium deposition examined in rat primary osteoblasts after 12 h stimulation with either increasing (
 10-20-30 dyn/cm2) or decreasing (
 30-20-10 dyn/cm2) FSS relative to static control (=1). The cacium and ALP were normalized with total protein of cells. To indicate significant difference between pair comparison, the following symbals are used: * FSS vs the static control; # stepwise increasing FSS vs decreasing FSS.

