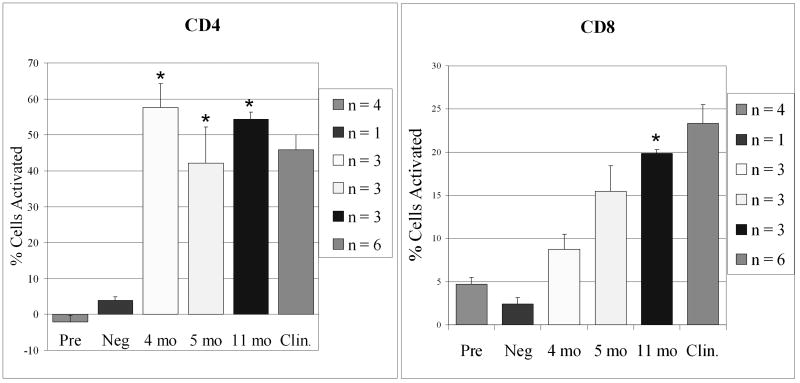
Figure 3.
Comparison of the expression of CD25 on activated CD4 and CD8 memory cells. The first bar shows pre-inoculation samples that were taken from all of the calves. The second bar shows the mean of the control negative calf sampled over 3 time points and bars 3-5 show the means of the inoculated calves at 4, 5 and 11 months PI. Bar 6 shows expression of CD25 on cells from clinical cows was similar to the expression on cells from experimentally inoculated calves. Asterisks indicate statistical significance difference P < .05 compared to pre inoculation results. Results from clinical cows were not significantly different from results from calves 11 months PI.

