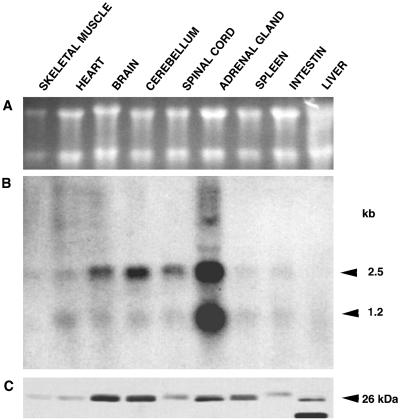
Figure 3.
Expression of phocein. (A) Northern blot made with total RNA from different rat tissues (10 μg/lane); ethidium bromide staining of the blot region corresponding to rRNAs. (B) This Northern blot was analyzed with a 659-bp phocein probe (nucleotides −7 to +652). Sizes of the transcripts are indicated on the right. (C) Multitissue Western blot (120 μg of cytosolic protein/lane) revealed with affinity-purified anti-phocein antibodies (0.5 μg/ml). The molecular mass of phocein is indicated on the right.

