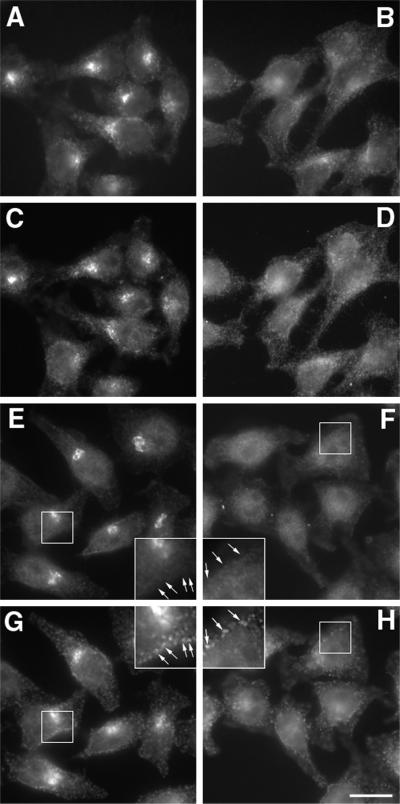
Figure 7.
Phocein is mislocalized to cytosol in BFA-treated cells. Ethanol (A, C, E, and G)- and BFA (B, D, F, and H)-treated cells (A–D, 2-min treatment; E–H, 10-min treatment) were fixed and processed for immunofluorescence microscopy using an anti-γ-adaptin monoclonal antibody (100.3; A and B), the polyclonal, affinity-purified anti-phocein antibodies (C–F), and an anti-clathrin monoclonal antibody (CON-1; G and H), revealed by a Texas Red-labeled antibody raised against mouse immunoglobulins and an Alexa 488-labeled antibody raised against rabbit immunoglobulins. Cells were observed under an epifluorescence microscope attached to a cooled charge-coupled device camera. The same field is shown in A and C, in B and D, in E and G, and in F and H. Note that in G clathrin coats are seen over the Golgi area as well as at the plasma membrane, whereas in H, the only clathrin coats left are localized at the plasma membrane. From E to H, insets show a higher magnification (2×) of the portions of cells included in squares. Bar, 15 μm (30 μm in the insets).

