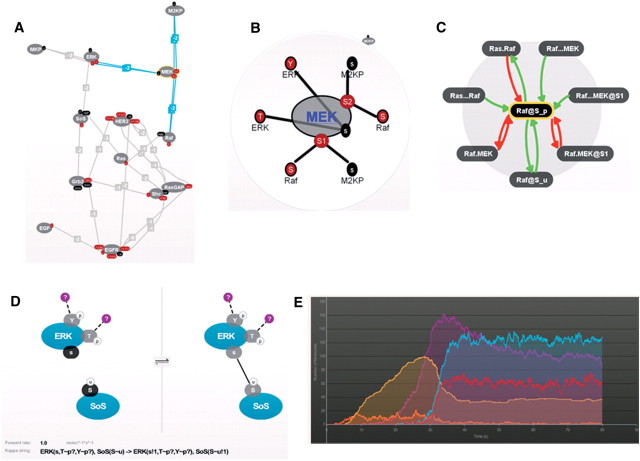
Figure 6:
Modelling with Cellucidate. (A) A model representing part of the EGFR cascade. Proteins and their interaction sites are the nodes with edges connecting interaction sites. (B) A zoom-in on MEK with its interaction sites and their connections. (C) A different view of Raf and its interactions, where activating relations are in green and inhibiting relations are in red. (D) A zoom-in into a rule: if sites Y and T of ERK are phosphorylated and may or may not be bound, and site S of SoS is ubiquitinated then site s of ERK and site S of SoS can bind, which changes their state from unbound (left) to bound (right). (E) A simulation of the model showing the change in number of molecules over time. Figure reproduced with permission from Plectix [46].

