
Fig. 1.
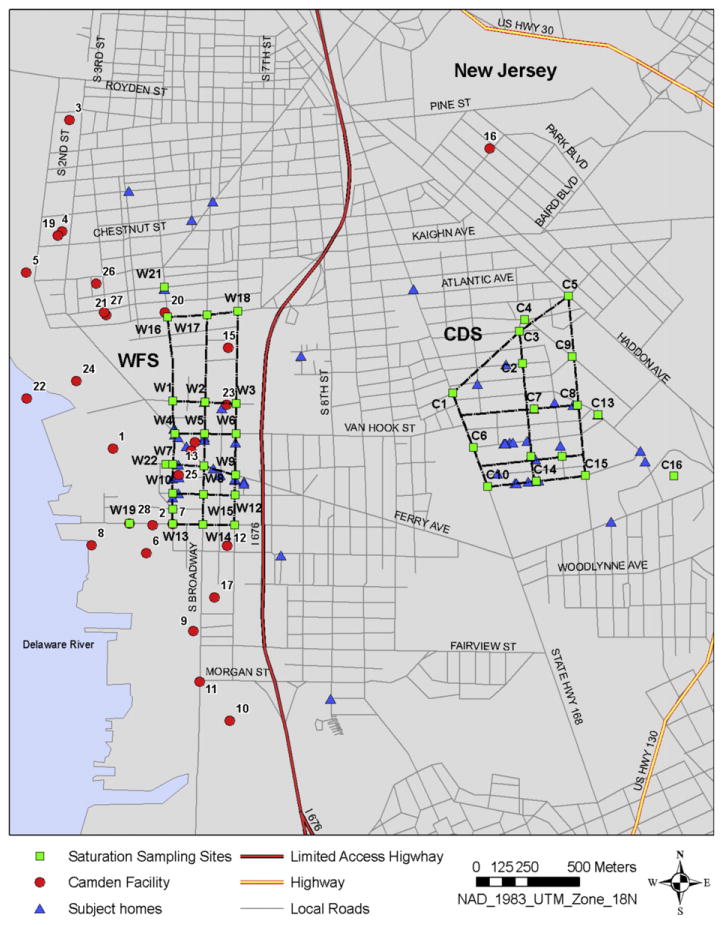
Spatial saturation sampling sites in WFS (left) and CDS (right) areas. The facility number (e.g. 1, 6 in the map) is equivalent to the source number (e.g. S1, S6, etc.) in the text and Table 4.
Official websites use .gov
A
.gov website belongs to an official
government organization in the United States.
Secure .gov websites use HTTPS
A lock (
) or https:// means you've safely
connected to the .gov website. Share sensitive
information only on official, secure websites.
Spatial saturation sampling sites in WFS (left) and CDS (right) areas. The facility number (e.g. 1, 6 in the map) is equivalent to the source number (e.g. S1, S6, etc.) in the text and Table 4.