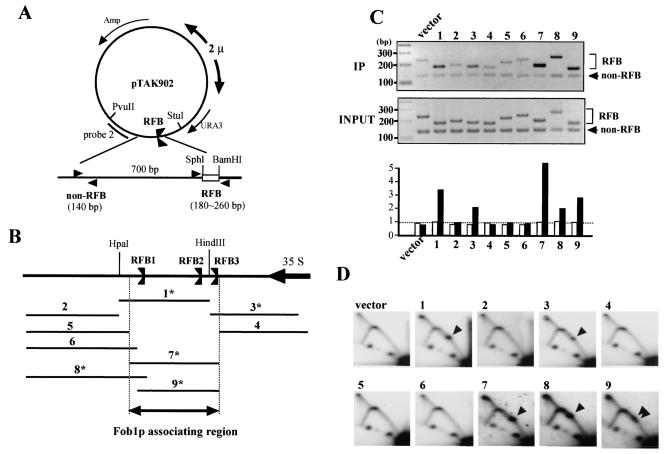
FIG. 3.
Identification of Fob1p association sites in the RFB. (A) Structure of pTAK902.1 to -9, which contain various subfragments of the RFB. RFB subfragments were inserted (between SphI and BamHI sites) near the 2μm replication origin, where they are predicted to inhibit the clockwise-moving replication fork. Positions of PCR primer sets used for the ChIP assay are shown by arrowheads (non-RFB and RFB). (B) Positions of the subfragments which were inserted into the SphI-BamHI site of pTAK902. The RFB1, RFB2, and RFB3 sites and the direction of 35S rDNA transcription are indicated. Numbers with asterisks indicate fragments that were associated with Fob1p (C) and inhibited the replication fork in the plasmid (D). (C) ChIP analysis by Fob1-FLAGp. Samples were prepared from NOY408-1bf strains carrying pTAK901 (Fob1-FLAGp expression vector) and pTAK902.1 to -9. In the top panel, DNA immunoprecipitated (IP) by the anti-FLAG antibody was used as the template, and in the middle panel, total DNA (whole-cell extract) was used as the template. Primer sets used for the ChIP assay are shown in panel A. Non-RFB and RFB primer sets amplified the vector sequence (lower bands) and inserted RFB subfragments (upper bands), respectively. Lane numbers above the panel correspond to the inserted fragments (panel B). vector, no RFB insertion in pTAK902. In bottom panel, the ratios of RFB to non-RFB are plotted. White and black bars indicate the values for input and IP, respectively. The values are relative to that of input vector. (D) Replication fork-blocking activities of various RFB subfragments on plasmid pTAK902. 2D analysis was performed as for Fig. 2C. DNA was prepared from the strains used for panel C, digested with PvuII and StuI, and subjected to 2D analysis followed by Southern hybridization with probe 2 (A). Numbers correspond to those of the subfragments in panel B. Spots indicated by arrowheads show accumulation of Y-shaped DNA molecules at the RFB site. vector, no RFB insertion in pTAK902.

