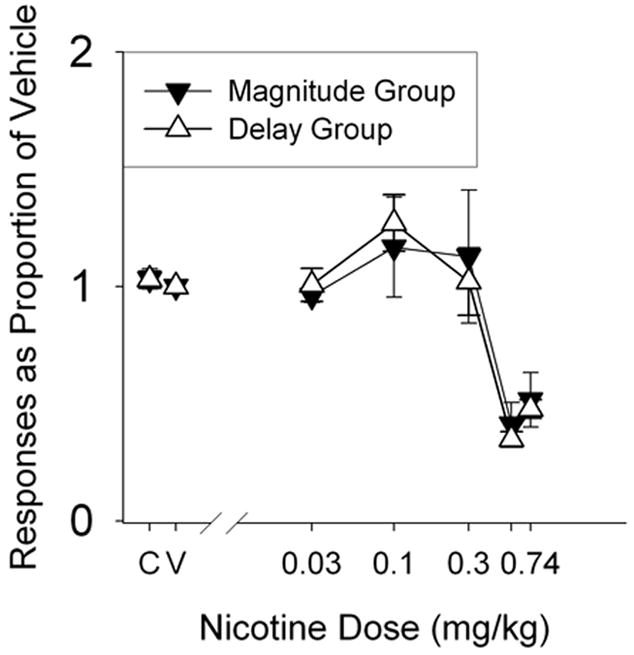
Figure 2.

Responses on both levers for the magnitude (closed triangles) and delay (open triangles) groups, as a proportion of responses under vehicle, for each nicotine dose. “C” and “V” indicate control (no injection) and vehicle (potassium phosphate) injection, respectively. Vertical lines represent standard errors of the mean.
