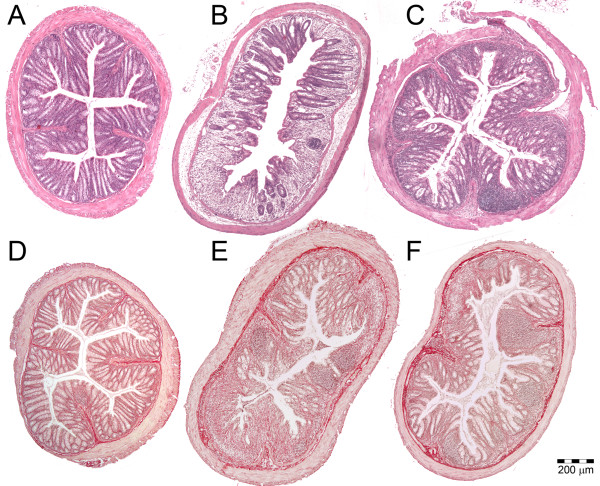
Figure 2.
Evaluation of treatment efficacy by colon histology. HE stained slides showing A: Healthy colon (score 0.0); B: severely inflamed colon (score 2.0) from the control group during acute colitis; C: colon with medium-grade acute colitis (score 1.0) representing 6-TG treated mice. Sirius red and Haematoxylin stained slides showing D: Healthy colon (score 0); E: colon with severe chronic colitis (score 32) from the control group; F: colon with medium-grade chronic colitis (score 20) representing 6-TG treated mice

