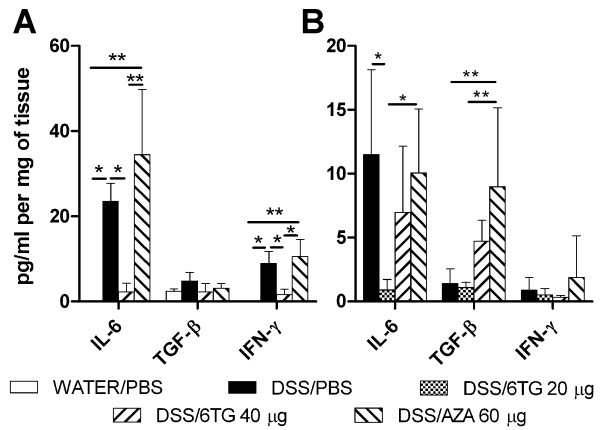
Figure 5.
Cytokine production in colon. Cytokine production by colon tissue as analysed by tissue fragment culture and measured by ELISA in (A) Acute and (B) Chronic colitis model. Values are expressed as mean (bar) ± SD (whisker). The differences among experimental groups were analyzed with one-way analysis of variance (ANOVA) with Tukey's multiple comparison test (*P < 0.05; **P < 0.01). Data depict one out of two independent experiments, each with 5 mice per group.

