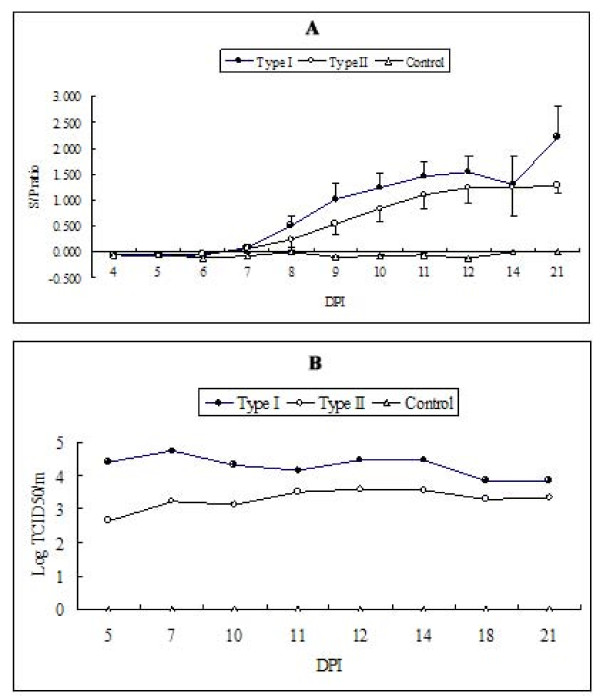
Figure 2.
PRRSV-specific serum IgG (A) and viremic titers (B). Error bars in type I and II-challenged groups indicate standard errors. For the quantitation of viremia, a commercial real time RT-PCR kit was used and virus titer was calculated using a standard curve generated from serially diluted type I or II virus isolates. Two serum samples from each dpc collection were stored until 21 dpc. At this point, they were pooled and quantitative RT-PCR was performed. Since no viral genome was detected in the control group, viral titer in control group sera was indicated as '0'.

