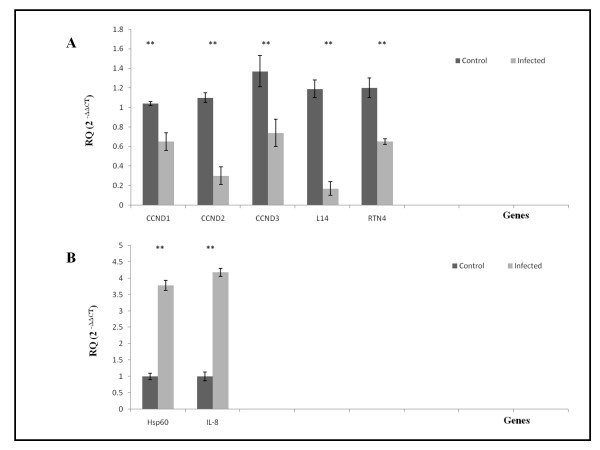
Figure 4.
Relative quantitation of down regulated and up regulated genes. A. Relative quantitation of CCND1, CCND2, CCND3, L14 and RTN4 genes was determined by real time RT-PCR and the fold difference (2-ΔΔCT ) between the study groups were calculated: Uninfected cells (Control); Infected cells (Infected). B. Relative quantitation of Hsp60 and IL-8 genes was determined by real time RT-PCR and the fold difference (2-ΔΔCT ) between the study groups were calculated: Uninfected cells (Control); Infected cells (Infected). The **(P value) for both sets of data is <0.05, indicating there are significant down regulation and up regulation in the infected cells compared to control.

