
Figure 2.
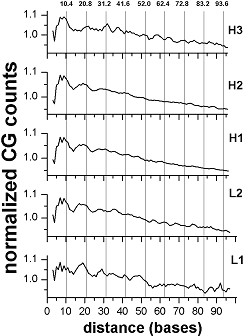
Positional autocorrelation of CG dinucleotides in different isochores of the mouse genome. The level 1.0 corresponds to 3.6 × 10³ for H3, 90.1 × 10³ for H2, 101.7 × 10³ for H1, 30.6 × 10³ for L2, 2.4 × 10³ for L1 (for further details see legend to Figure 1)