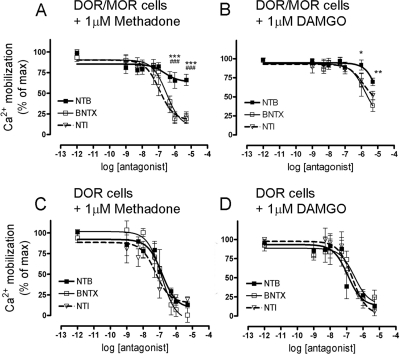
Fig. 6.
Reduced antagonism of DOR/MOR heteromer signaling is NTB specific. A and B, cells coexpressing DOR/MOR were pretreated with increasing concentrations of NTB (■), BNTX (□), or NTI (▵) for 20 min and signaling in response to methadone (A) or DAMGO (B) (both 1 μM) was measured as in Fig. 5. C and D, cells expressing only DOR are shown as a control for each antagonist upon methadone (C) or DAMGO (D) (both 1 μM) stimulation. Data represent means ± S.E.M. of n = four to five experiments carried out in triplicate (two-way ANOVA and Bonferroni post-test: *, p < 0.05, **, p < 0.01, ***, p < 0.001 NTB compared with BNTX; ###, p < 0.001 NTB compared with NTI). See Table 2.

