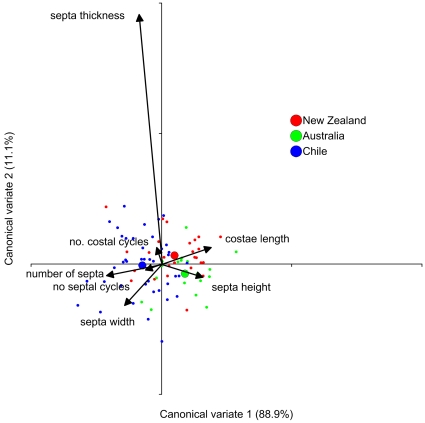
Figure 3. Results from Canonical Discriminant Analysis (CDA) of eight skeletal characters of Desmophyllum dianthus from SE Australia, New Zealand and Chile.
Larger circles represent group means for each geographic region. The bi-plot is overlayed on the data graph and shows relative contributions of each of the skeletal characters to the separation of the groups. The character corallite size is not shown as part of the bi-plot as it contributed almost nothing to the separation of the groups in the analysis.

