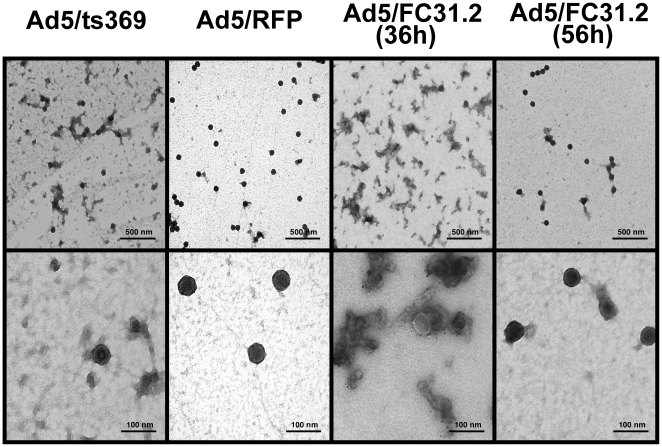
Figure 5. Electron microscopy analysis of CsCl-purified Ad5/ts369 and Ad5/RFP viruses at 36 hpi and attB-Ad at 36 and 56 hpi in HEK293 cells.
Uranyl acetate staining was used to visualize viral particles. Representative sections among multiples pictures are shown. Bar equals 500 nm on top row and 100 nm in bottom row.

