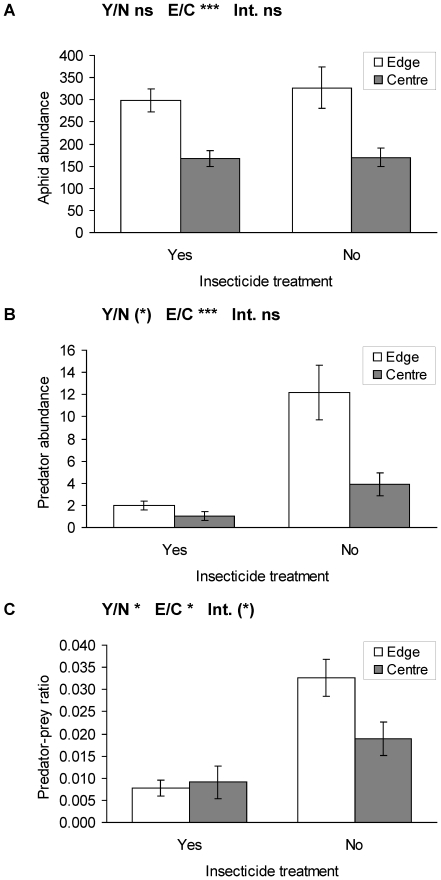
Figure 4. Abundances of (a) aphids, (b) aphid-predators and (c) predator-prey ratio in insecticide treated and non-treated conventional triticale field edges and centres (mean ± se).
Y/N: treated/not treated fields, E/C: edge/centre in field, Int: Interaction term. *** p≤0.001, * p≤0.05, (*) p≤0.1, ns p>0.1. Statistics see Table 4.

