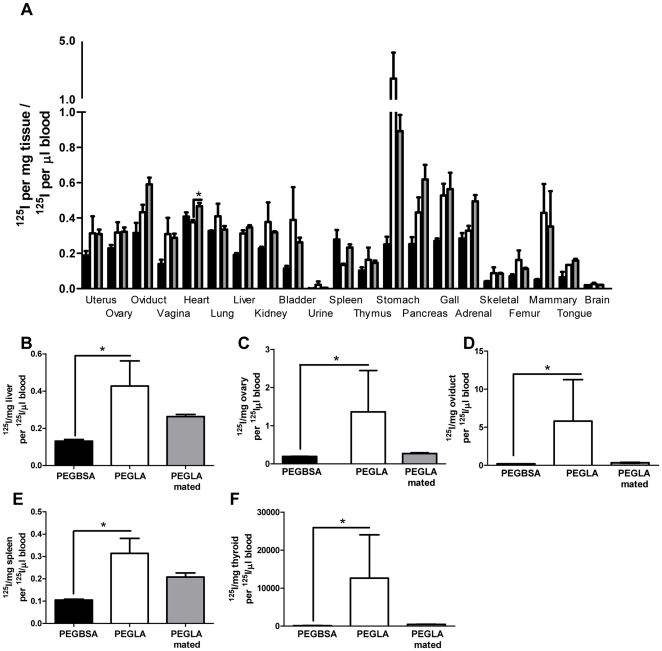
Figure 6. Tissue accumulation of 125I-PEGLA and 125I-PEGBSA following IP injection in non-mated (PEGLA: black; PEGBSA: white) and mated (PEGLA: grey) females.
The counts given are normalised to the 125I counts in total blood (counts/µl). A. 2 h post-injection; B. Liver at 24 h post-injection; C. Ovary at 24 h post-injection; D. Oviduct at 24 h post-injection; E. Spleen at 24 h post-injection; F. Thyroid at 24 h post-injection. *, significant difference between treatment groups (p<0.05).

