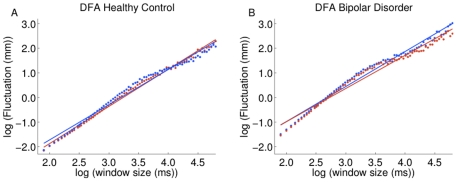
Figure 2. Detrended fluctuation analysis for derived from the exemplar COP data shown in Figure 1 for the eyes open-open base condition (blue) and the eyes closed-open base condition (red).
Data for the control and bipolar disorder participant can be found in Panel A and B, respectively. Each individual symbol in each panel plots the fluctuation magnitude against the particular timescale on which it is measured. The slope of the fitted line for each condition produces the α-value, which is the primary dependent variable for DFA.

