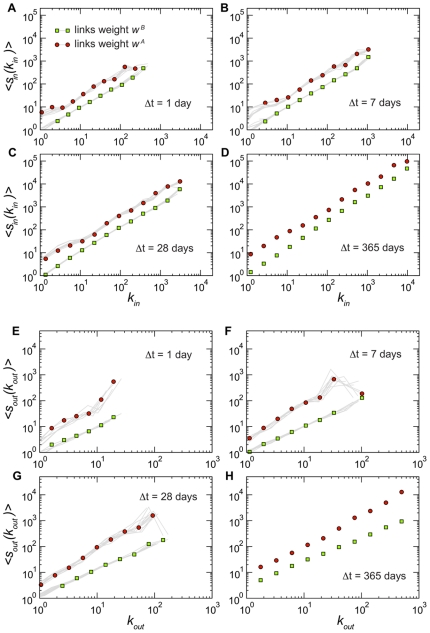
Figure 3. Relation between the number of bovine traffic movements of a holding and its number of connections for different values of  .
.
Panels A to D report the average in-strength of nodes with a given value of in-degree, whereas panels E to H present the average out-strength of nodes with given out-degree. The same representation of Figure 1 is adopted, with symbols representing the result of a particular snapshot, and grey lines the results obtained for a subset of the other snapshots.

