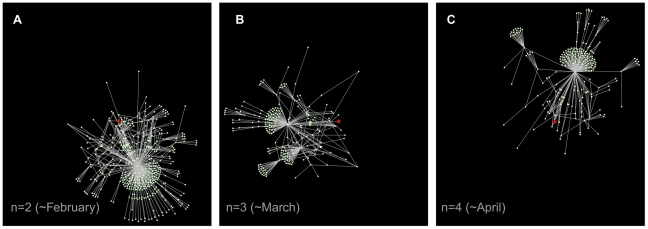
Figure 5. Neighborhoods of a selected node in three consecutive monthly networks.
The subgraphs are obtained by showing all nodes within distance 3 from a selected node (in red in the figure), for consecutive monthly snapshots. The visualization highlights how the neighborhood of a given node may strongly change its structure in time. It is important to note that nodes that disappear from the plots may still be present in the network, but are not shown as they may be at distance larger than 3 from the seed, thus not belonging to its neighborhood.

