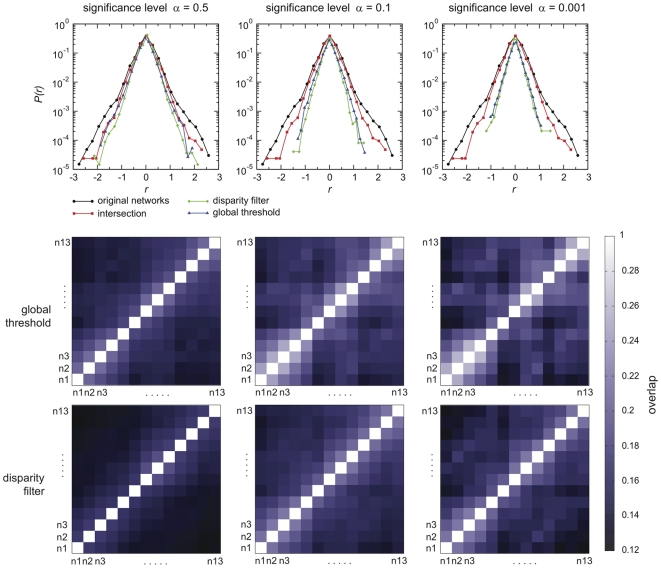
Figure 10. Evolution of monthly network backbones.
Top: Distributions of the growth rates of the weights  of the backbone links, where the network backbone is obtained under different filtering procedures. In each case, growth rates r are measured only for links that are present in two successive backbones. Center and Bottom: Overlap between the backbones of monthly networks. The overlap measures the number of links common to the pair of networks under consideration, normalized by their total number of links. Backbones are obtained either with a global threshold filter (center row) or using a disparity filter (bottom row). Three values of the significance parameter
  are considered.

