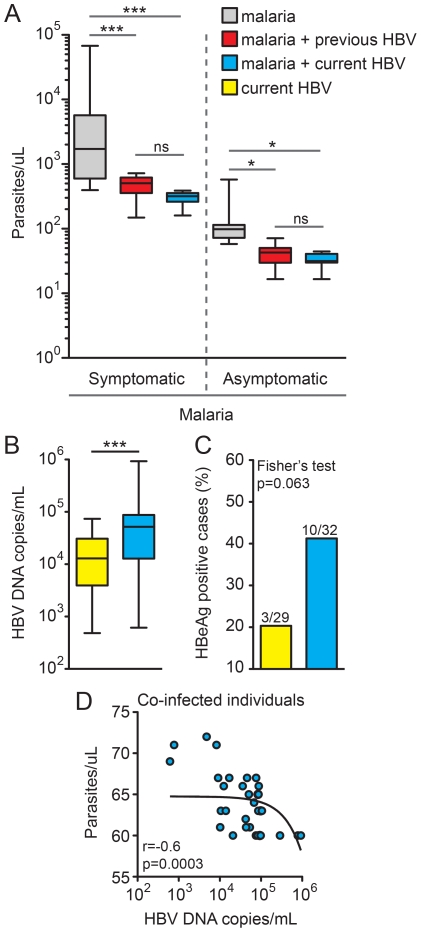
Figure 3. Individuals co-infected with Plasmodium sp. and HBV present lower parasitemia and higher viremia.
(A) Individuals presenting with symptomatic or asymptomatic malaria were stratified according to the HBV status, and parasitemia levels were determined by light microscopy as described in the methods. The number of participants in each group is described in Table 1. Values were compared by the Kruskal-Wallis test with Dunn's multiple comparisons posttest. (B) HBV viremia was estimated by real-time PCR in both HBV infected (n = 29) or HBV-malaria co-infected (n = 32) individuals using the Mann-Whitney test and the percentage of HBeAg positive cases was also compared to these groups (C) using Fisher's exact test. Lines and boxes represent medians and interquartile ranges, and whiskers represent minimum and maximum values. (D) Spearman correlation between Plasmodium parasitemia and HBV viremia in co-infected individuals (n = 32). A non-linear curve fit was used to illustrate the general trend of the correlation. *P<0.05; ***P<0.0001.

