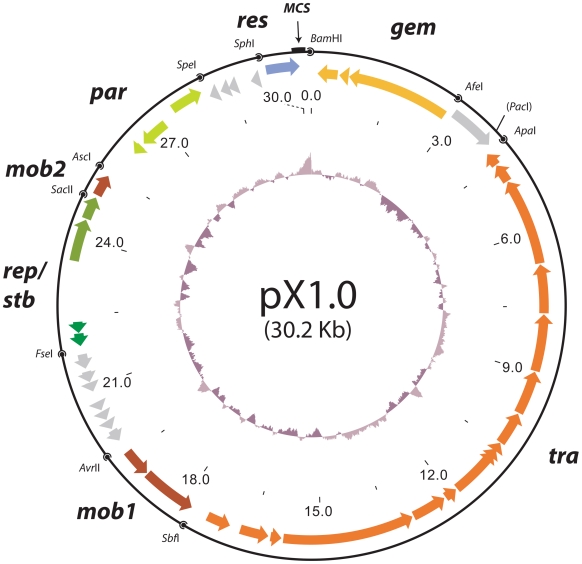
Figure 2. Genetic map of pX1.0.
The GC-content is depicted in the central part of the map. Open reading frames are shown as colour coded arrows, indicating their function and transcribed direction. The ORFs are divided into the following modules: gem (gene expression modulation), tra (conjugal transfer), mob1 (mobilization 1), rep/stb (replication initiation/toxin-antitoxin plasmid addiction), mob2 (mobilization 2), par (plasmid partitioning) and res (resistance marker). Unique restriction sites are shown at the module junctions. MCS represents the restriction sites PmeI, AbsI, MreI, KpnI, SwaI, NotI and SgrDI.

