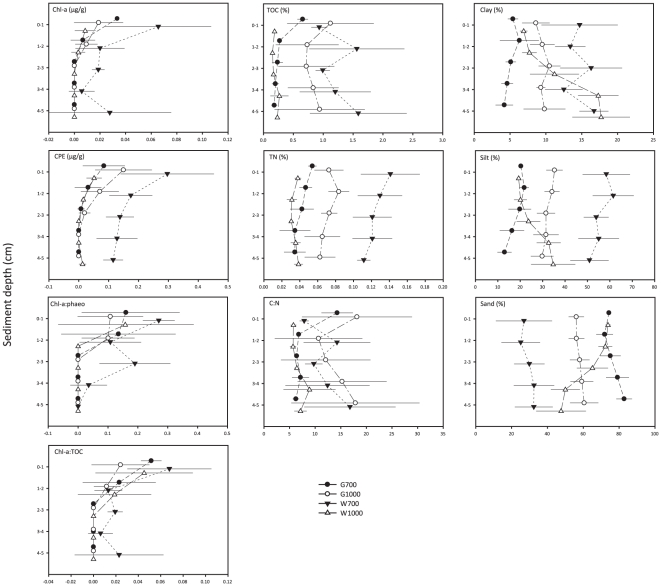
Figure 3. Average values for selected sedimentary biogeochemical parameters along the vertical sediment profile.
Chl-a: chlorophyll a; CPE: chloroplastic pigment equivalents; Chl-a∶phaeo: chlorophyll a divided by its degradation products (phaeophytines) indicating ‘freshness’ of the phytodetrital OM; Chl-a∶TOC: chlorophyll a divided by total organic carbon content indicating bioavailability of the bulk OM; TOC: total organic carbon concentration; TN: total nitrogen concentration; C∶N: molar carbon/nitrogen ratio; Clay, Silt, Sand: volume percent clay, silt, sand content, respectively. G1000: Gollum Channel at 1090 m depth, G700: Gollum Channel at 755 m depth, W1000: Whittard Canyon at 1160 m depth, W700: Whittard Canyon at 762 m depth. Values averaged over replicates; error bars denote standard deviations.

