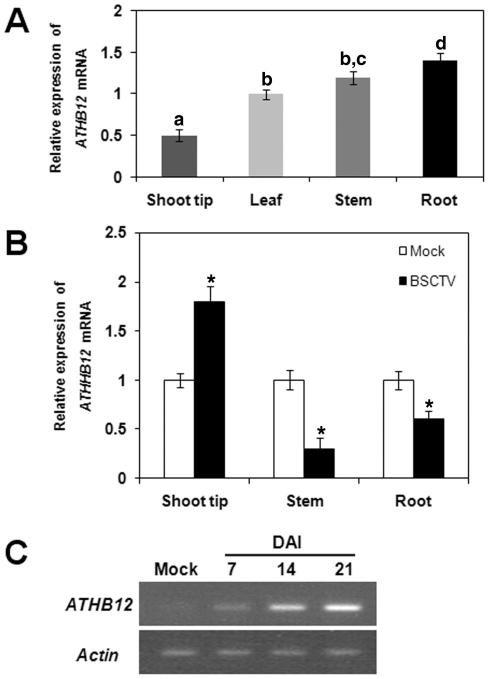
Figure 2. Comparison of ATHB12 gene expression in uninfected and BSCTV-infected Arabidopsis plants.
(A) ATHB12 gene expression in inflorescence shoot tips, leaves, inflorescence stems, and roots of uninfected Arabidopsis. (B) ATHB12 gene expression in BSCTV-infected plants showing significant induction in symptomatic inflorescence shoot tips. (C) Time course of ATHB12 accumulation in response to BSCTV infection using semi-quantitative PCR. The data shown in (A) and (B) represent the mean ± S.D. of three or four experiments. Different letters (Panel A) or * (Panel B) refer to significant differences between mean values as determined using a Tukey's Multiple Comparison Test (P<0.05).

