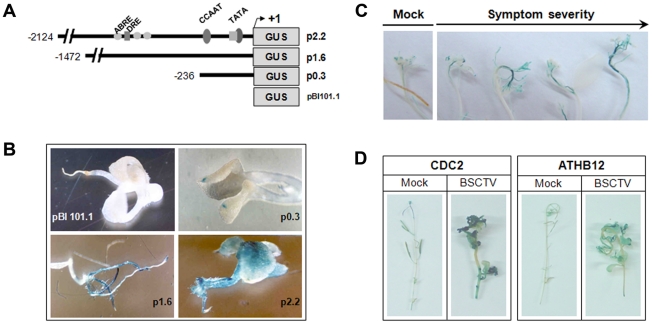
Figure 3. Localization of GUS activity in Arabidopsis plants expressing ATHB12 promoter-gusA fusion or CDC2 promoter-gusA fusion constructs.
(A) Diagram depicting the three ATHB12 promoter fusions used for these studies. The positions of several specific known transcription binding sites are shown. (B) GUS staining of representative plants expressing the three ATHB12 promoter-gusA fusions. Note that the p2.2 line showed systemic GUS staining throughout the seedlings, whereas the p1.6 and p0.3 lines only stained positive in the roots and cotyledons, respectively. Based on this result we utilized the p2.2 line for BSCTV infection studies. (C) GUS staining of BSCTV-infected plants. All infected plants had a high intensity of GUS staining in the symptomatic tissues in the inflorescence shoot tip where aberrant cell division was evident in response to BSCTV infection. (D) Comparison of ATHB12 and CDC2 promoter activity in BSCTV-infected plants. All infected plants showed significant GUS staining in the symptomatic inflorescence shoot tips, demonstrating a correlation of ATHB12 induction with the activation of CDC2. The pBI101.1 line was used for a negative control in all studies and was always negative for GUS activity.

