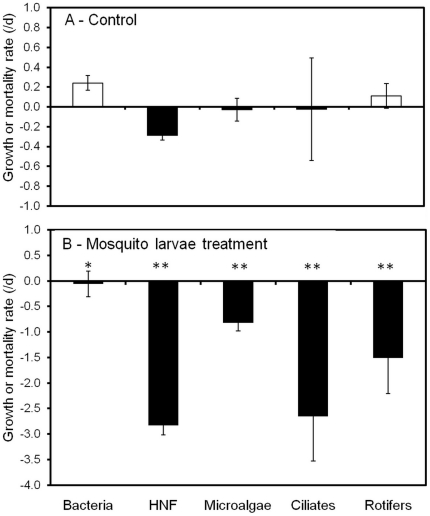
Figure 5. Growth (white bars) or mortality (black bars) rates of microorganisms determined from changes in densities during the 24-h experiment.
Treatments are: (A) control and (B) with mosquito larvae. Values are the means of four replicates. Asterisks in (B) indicate significant differences in the values relative to (A) (One way ANOVA, *P<0.05, **P<0.01).

