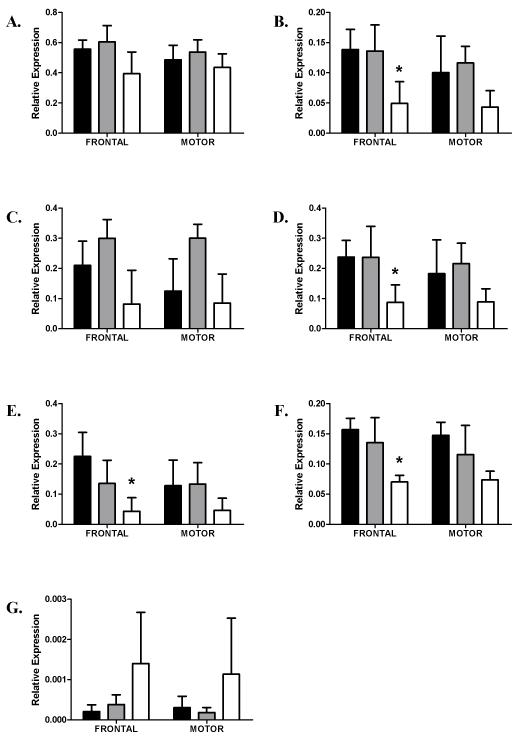
Figure 2.
Relative expression in Prefrontal and Motor cortices in females. Data is presented as mean ΔCT converted to 2−ΔCT (with S.E.Ms). Asterixes denote significant changes between control and cirrhotic alcoholics (Tukey hsd P < 0.05). Key as for Fig. 1. Significantly lower expression of 14-3-3 γ, ζ, η, and θ was seen in the prefrontal cortex only of female cirrhotics compared with controls.
A. 14-3-3β
B. 14-3-3γ (PFC, F2,22 =3.93, P = 0.035, Motor, F2,22 = 1.61, P = 0.22)
C. 14-3-3ε
D. 14-3-3ζ (PFC, F2,22 =3.51, P < 0.05, Motor, F2,22 = 1.26, P = 0.30)
E. 14-3-3η (PFC, F2,23 =3.68, P = 0.04, Motor, F2,23 = 1.28, P = 0.30)
F. 14-3-3θ (PFC, F2,23 =6.8, P = 0.005, Motor, F2,23 = 2.78, P = 0.08)
G. 14-3-3σ

