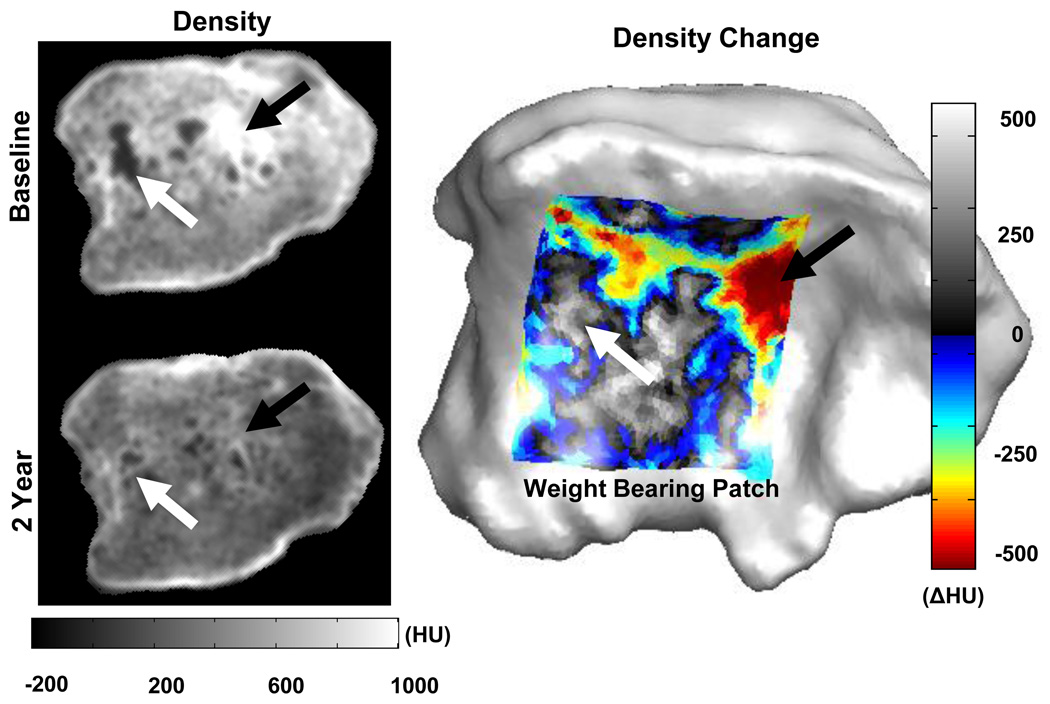
Figure 4.
After two years of distraction, the normalization of bone densities is evident on CT (left). The change in bone density (2yr-baseline) in the weight bearing area of the tibia (mean from 1–3 mm depth), right, depicts the increase in density near cysts (white arrow), and a decrease in density in sclerotic regions (black arrow).

