Figure 5.
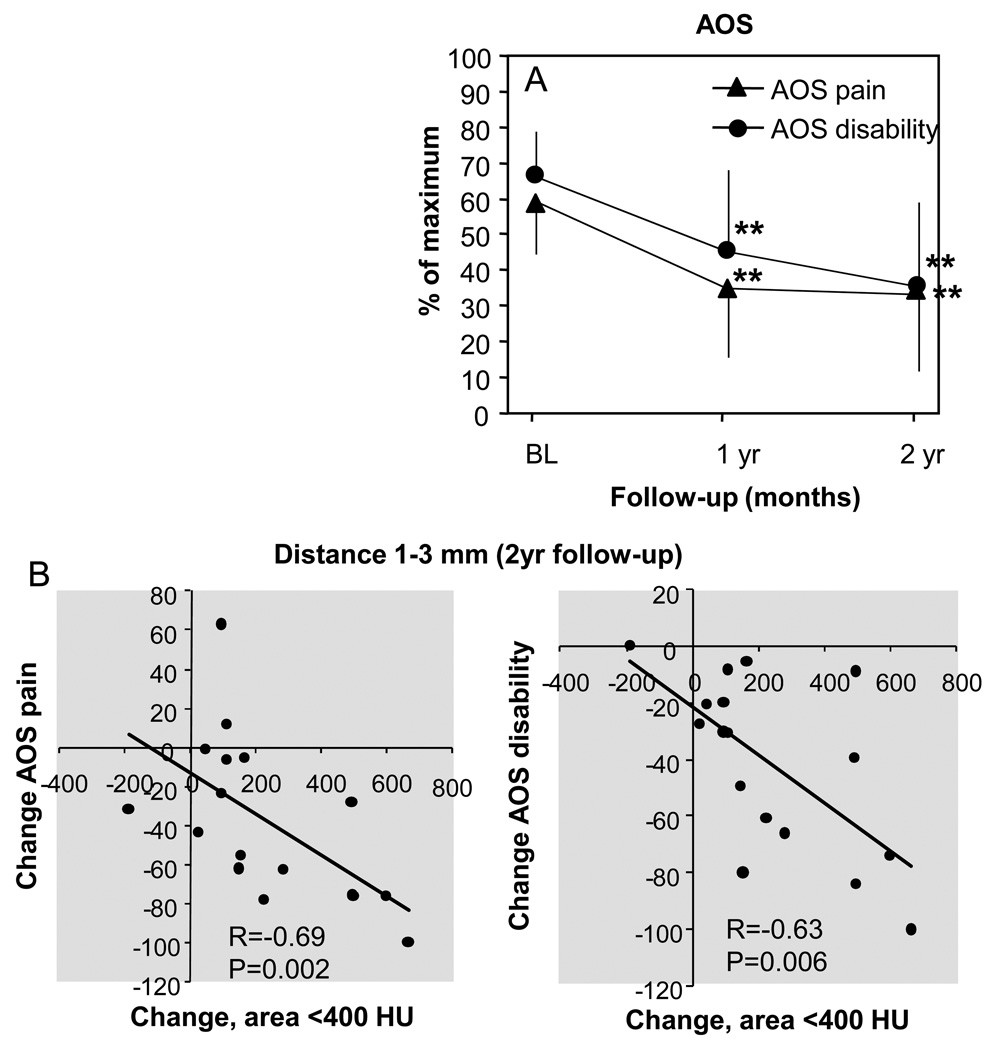
A. Clinical outcome presented by the AOS score (mean±SD). Subscales pain and disability are shown on a scale of 0–100 (100 being the worst outcome). ** indicate p-values <0.001 compared to baseline. B. Correlations between percentage change in AOS subscale and change in density in low density areas (sum of change of the tibia and talus).

