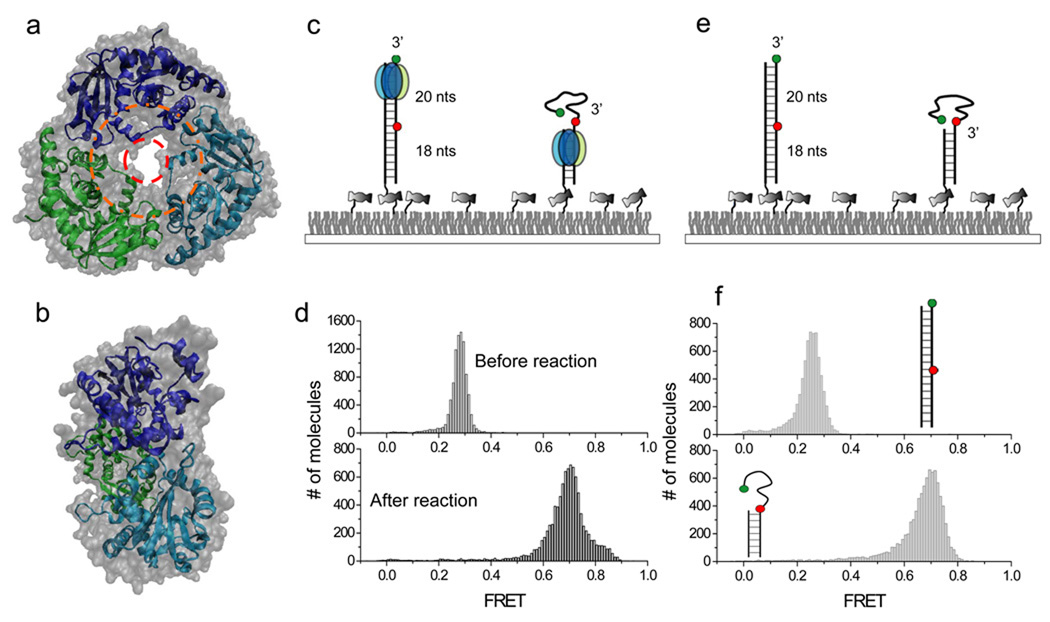
Figure 1.
Single molecule FRET assay for λ exonuclease activity. (a) Top-to-bottom view of the crystal structure of λ exo. dsDNA is thought to enter the outer ring with ~30Å diameter (orange) with ssDNA product exiting from the inner ring with ~15Å diameter. (b) Side view of the crystal structure tapered from the entrance on the right to the exit on the left. (c) Experimental schematics before (left) and after (right) degradation by λ exo. The enzyme converts dsDNA between the donor (green) and the acceptor (red) to ssDNA, causing an increase in FRET. (d) Single molecule FRET histograms before and after the degradation. (e) A partial duplex mimicking the degradation product was constructed to estimate the FRET value after the degradation. (f) Single molecule FRET histograms built from dsDNA and partial duplex in the absence of λ exo.

