Figure 6.
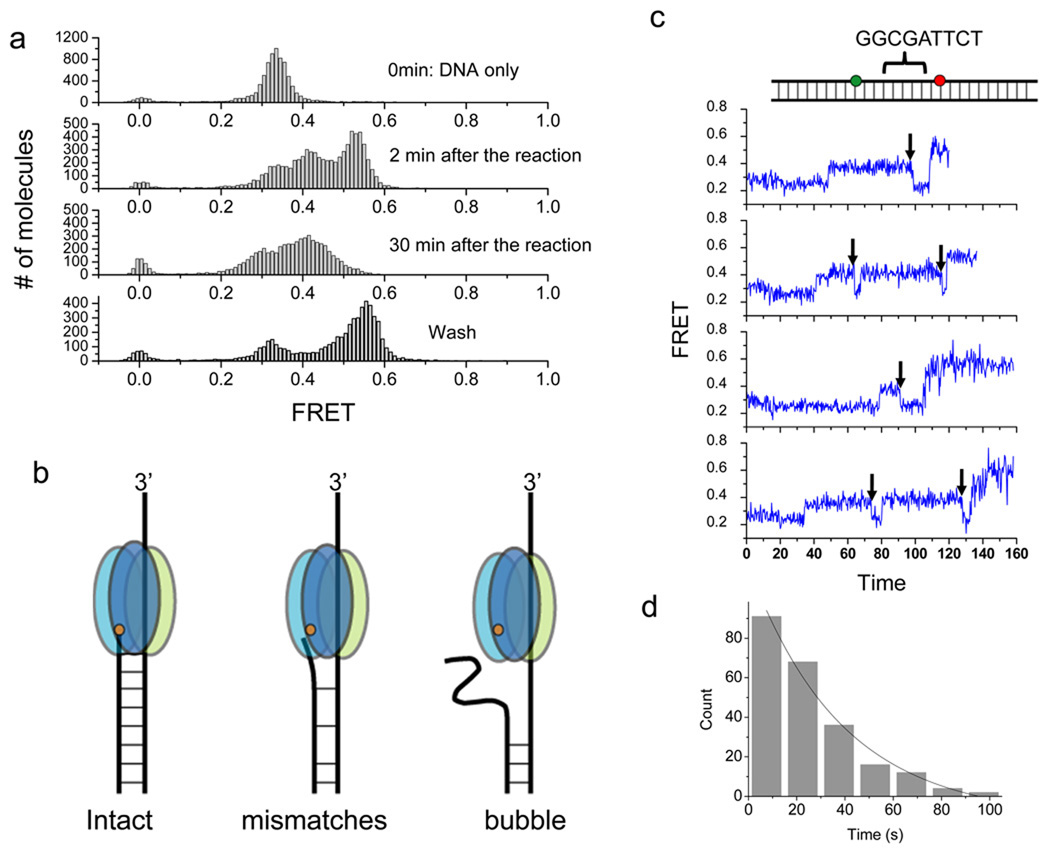
Degradation arrest on a bubble DNA and escape from a known pausing sequence. (a) Single molecule FRET histograms of a bubble DNA construct with 18 nt mismatches between the donor and the acceptor. DNA only (upper panel); 2 min incubation with 120 nM protein (second panel); 30 min incubation (third panel); and washed after 30 min incubation (bottom panel) (b) Model of λ exo degradation intact, mismatched and bubble DNA. The bubble causes degradation arrest. The orange dot represents the active site of λ exo. (c) Representative single molecule time traces of FRET efficiency during degradation of a DNA construct containing the known pausing sequence (cartoon on the top) at 120 nM protein. After it pauses, λ exo appears to backtrack (FRET decrease, black arrows) before continuing to degrade the DNA. (d) Histogram of pause duration and an exponential fit. The average pause duration is 24.2s ± 1.3 (229 molecules).

