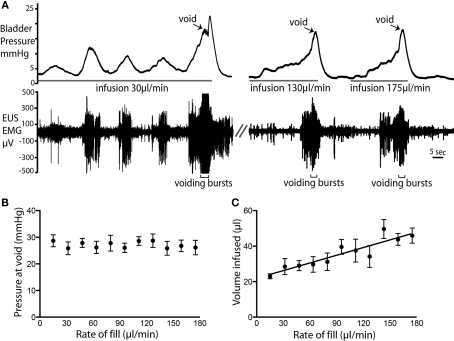
Figure 4.
Rate of fluid infusion and bladder pressure at void. (A) Example voids showing that at slower infusion rates (e.g., 20 μl/min) it took longer for a void to be triggered and a larger number of NMCs were observed before the void. Note also the EMG activity that accompanied each NMC. At higher infusion rates, fewer NMCs occurred before the void. (B) The rate of fluid infusion did not significantly alter the bladder pressure at which the void occurred (C) A statistically significant linear relationship (P < 0.0001; R2 = 0.83; n = 4) was observed between infusion rate and the volume infused into the bladder before voiding was triggered.

