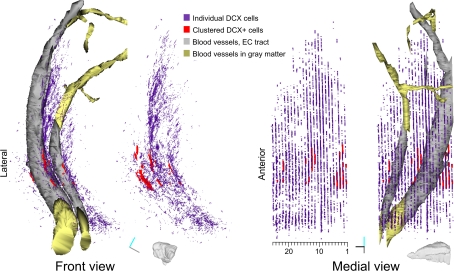
Figure 3.
Reconstruction of DCX staining distribution in LS. Front and medial views of a 3D model of DCX staining distribution in the LS of guinea pig. For both views the model is shown either with or without blood vessels. The model is about 30° rotated medially, to give a more comprehensive visualization on the medial view. This model is the result of the tracing of individual DCX+ cells and processes (violet), clustered DCX+ cells (red), blood vessels passing through the EC (gray and gold). Tracts of the blood vessels running in the EC or in the gray matter are depicted as separate Boissonnat surfaces colored in gray and golden respectively. Both DCX+ staining and clustered DCX+ cells are represented as traces slabs. A scale indicating the number of individual sections in the reconstruction is shown under the medial view of the model. Orientation Bars: gray line: medial; cyan line: dorsal; dark line: rostral.

