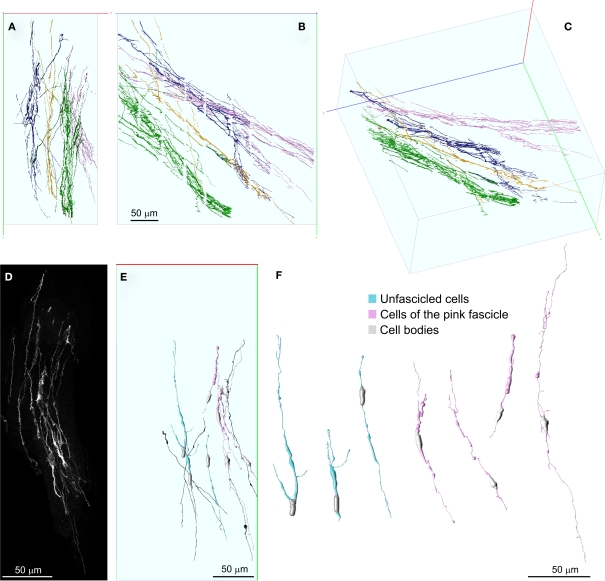
Figure 7.
Detailed 3D representation of DCX+ cells and processes within and among fascicles. (A–C) Front (A), lateral (B), and perspective (C) views of DCX+ processes within and among four separate fascicles, represented in different colors. Fascicles were automatically segmented in Neuronstudio and rendered in V3D neuron. No manual editing has been performed in order to connect corresponding processes at the inter-slice gaps. The numerous small orthogonal branches in (B) are artifacts of the automatic tracing algorithm. (D) MIP of the DCX+ processes composing the pink colored fascicle after a manual cut-off of surrounding areas section by section. (E,F) 3D reconstructions of individual DCX+ cells isolated (cyan) or being part of the pink colored fascicle (pink). Some individual DCX+ process, whose cell body was not included in the reconstructed volume, are also shown (dark) in (E). These cells were reconstructed in Neuromantic and rendered in V3D neuron. Note these cells are mostly bipolar and show long and poorly ramified processes. Orientation Bars: gray line: medial; cyan line: dorsal; dark line: caudal.

