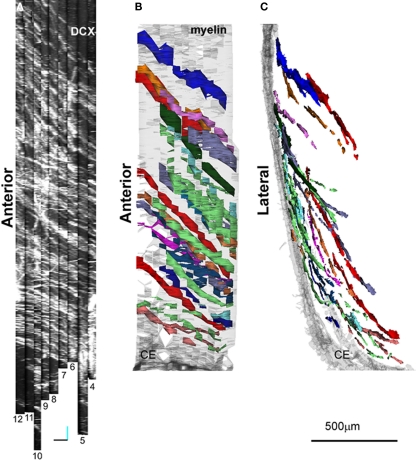
Figure A1.
Comparison between the orientation of DCX+ fascicles and internal capsule fiber bundles. In (A) MIP along the y-axis of the 20 reconstruction as shown in Figure 4C. In (B,C) lateral and caudal views, respectively, of a rough 3D reconstruction of part of the internal capsule fiber bundles (stained with MAG) running through the LS. The reconstruction has been obtained from 15 subsequent 40 µm thick sections and has been rendered in Reconstruct.

