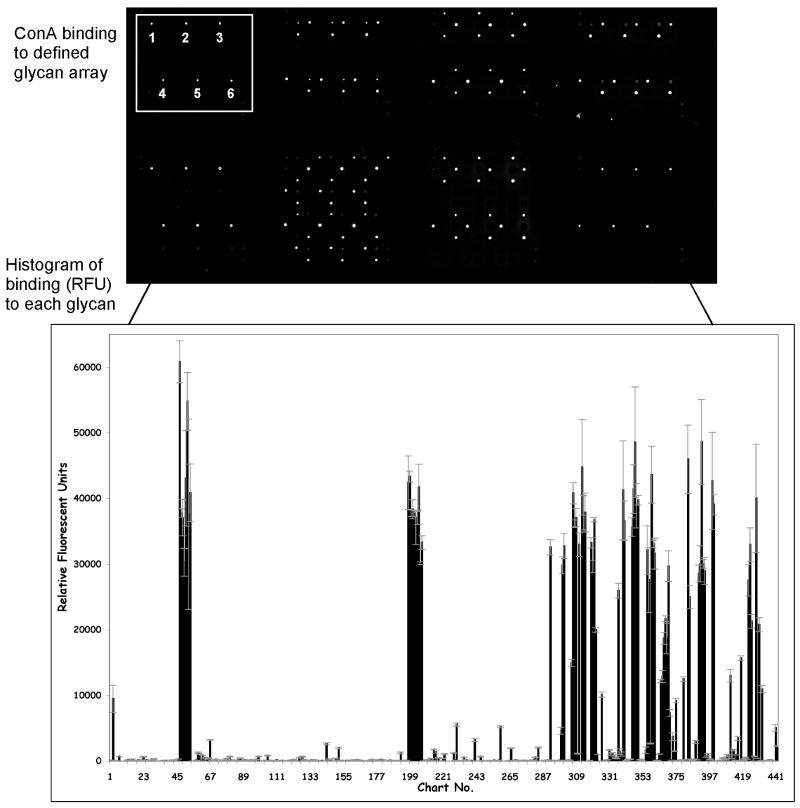
Figure 1.
Con A binding to the CFG glycan array. The top panel is an image of fluorescently detected Con A binding to the glycan array slide. The replicates of one set of 6 spots, corresponding to one glycan, are noted. The bottom panel is a histogram of quantified Con A binding to the glycan array, where the x-axis is the chart number (glycan number) and the y-axis is relative fluorescent units (RFU).

